For the past year or so, I’ve been working with DevOps in Tulip. It’s a fairly big change in direction but quite frankly, it’s been a refreshing experience!
One of the first projects was to build a monitoring system for a number of different components in our kubernetes cluster: various microservices, main monolith application, our ingress controller, and the health of the cluster itself. I thought Prometheus fit fairly well with what we wanted, so we went ahead with that. I would say that it has been served us pretty well!
Prometheus
Some context about Prometheus; it is a pull-based monitoring system that is sometimes compared to Nagios. It’s not event-based, so applications do not report each individual event to Prometheus as it happens (like SegmentIO). Also, since its pull-based, we have to define all its targets (to scrape) in advance. Contrary to certain arguments, I actually think this is a plus. It is more tedious and harder to set up, but it is also harder to get into a situation where it becomes a blackbox and you have no idea what you’re dumping into it. It’s also easier to detect if a target is actually down vs a push-based system.
Prometheus Operator
Prometheus Operator is an open-source tool that makes deploying a Prometheus stack (AlertManager, Grafana, Prometheus) so, much easier than hand-crafting the entire stack. It helps generate a whole lot of boiler plates and pretty much reduces the entire deployment down to native kubernetes declarations and YAML.
If you’re familiar with Kubernetes, then you’ve probably heard of custom resource definitions, or
CRDs in short. Think of them as definitions of objects like pods, deployments or daemonsets
that the cluster can understand and act on if needed. For the purpose of deploying a monitoring stack,
Prometheus Operator introduces 3 new CRDs - Prometheus, AlertManager and ServiceMonitor, and a controller
that is in-charge of deploying and connfiguring the respective services into the Kubernetes Cluster.
For example: if a prometheus CRD like the one below is present in the cluster, the prometheus-operator controller would create a matching deployment of Prometheus into the kubernetes cluster, that in this case would also link up with the alertmanager by that name in the monitoring namespace.
apiVersion: monitoring.coreos.com/v1
kind: Prometheus
metadata:
  ...
  name: clustermon-prometheus-oper-prometheus
  namespace: monitoring
spec:
  alerting:
    alertmanagers:
    - name: clustermon-prometheus-oper-alertmanager
      namespace: monitoring
      pathPrefix: /
      port: web
  baseImage: quay.io/prometheus/prometheus
  ...
kube-prometheus
kube-prometheus used to be a set of contrib helm charts that utilizes the capabilities of the Prometheus Operator to deploy an entire monitoring stack (with some assumptions and defaults ofc). It has since been absorbed into the main helm charts and moved to the official stable chart repository.
There are various exporters included such as: kube-dns, kube-state-metrics, node-exporter and many others that are necessary to monitor the health of a Kubernetes cluster (and more). You can find the full list here. It also has a simple set of kubernetes-mixins for Grafana as well (if you choose to install that).
Overview
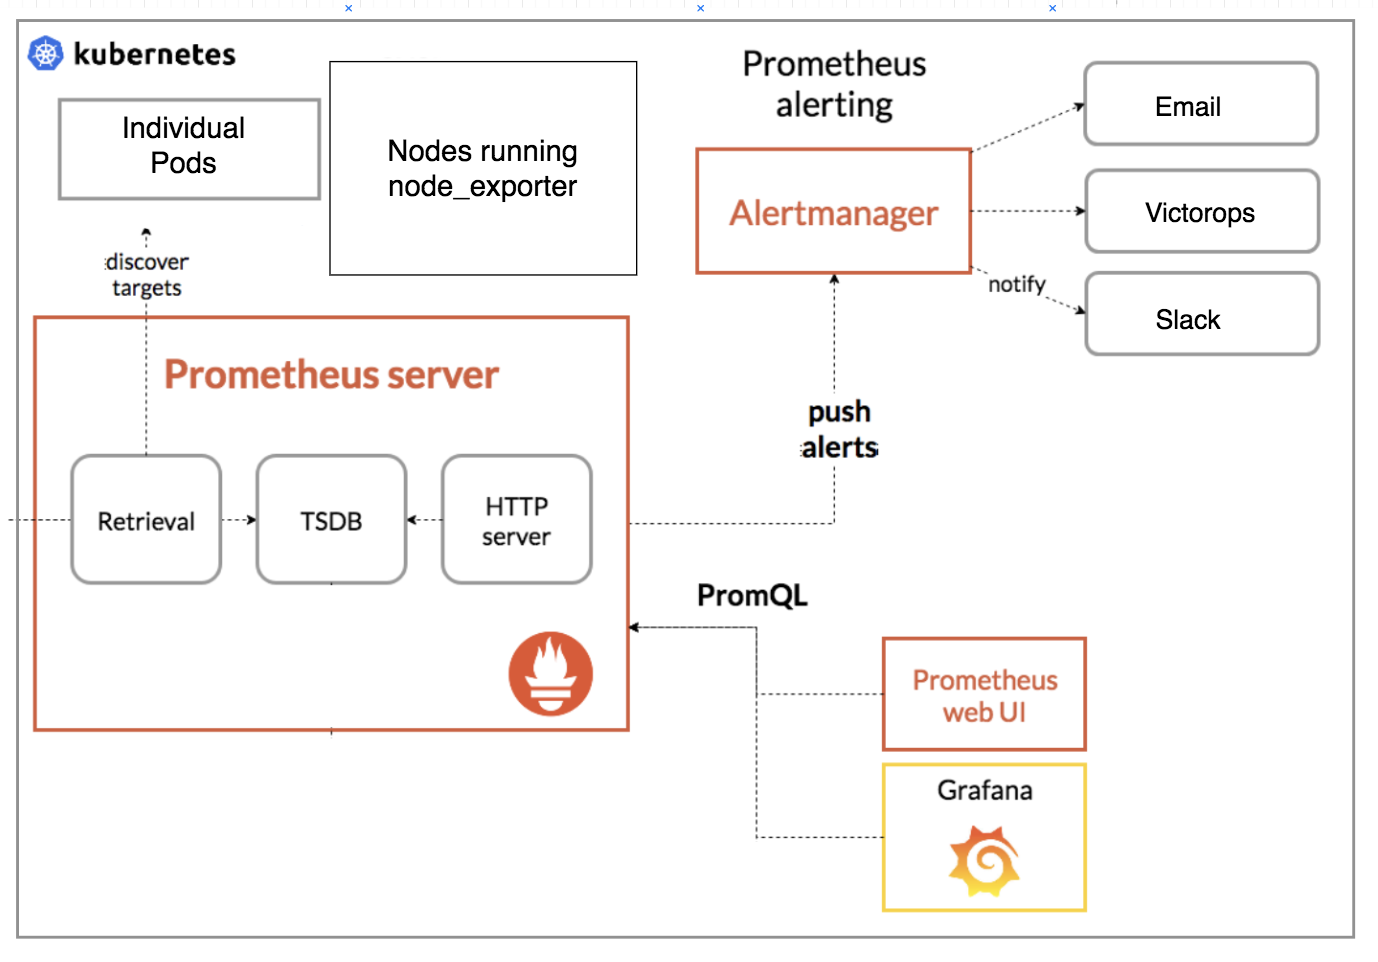
This section gives a general idea of the components involved.
An important implementation decision that I’ll like to point out is that Grafana is (mostly) stateless. Any new dashboards, or changes
would need to be commited to code; in general I think this conforms better to the infrastructure-as-code kind of idealogy which makes
it much easier to replicate the same infrastructure across multiple clouds / regions.
Custom Helm Chart
You can find a stripped down version fo the things I’ll talk about in this repository: k8s-prometheus-operator-helm-example
Note: The contents are all based on prometheus-operator helm chart 5.10.5.
# requirements.yaml
dependencies:
  - name: prometheus-operator
    version: 5.10.5
    repository: https://kubernetes-charts.storage.googleapis.com/
This part of the chart is responsible for loading *.json dashboard configurations exported from Grafana and creating
them as individual configmaps in Kubernetes. The config-reloaders in Grafana would then read them and reconfigure itself.
# templates/dashboards-configmap.yaml
{{- $files := .Files.Glob "dashboards/*.json" }}
apiVersion: v1
kind: ConfigMapList
items:
{{- range $path, $fileContents := $files }}
{{- $dashboardName := regexReplaceAll "(^.*/)(.*)\\.json$" $path "${2}" }}
- apiVersion: v1
  kind: ConfigMap
  metadata:
    name: {{ printf "%s-%s" (include "prometheus-operator.fullname" $) $dashboardName | trunc 63 | trimSuffix "-" }}
    labels:
      grafana_dashboard: "1"
      app: {{ template "prometheus-operator.name" $ }}-grafana
{{ include "prometheus-operator.labels" $ | indent 6 }}
  data:
    {{ $dashboardName }}.json: |-
{{ $.Files.Get $path | indent 6}}
{{- end }}
Prometheus
Prometheus rocks a TSDB for data storage so the instance that the pod runs on needs to have a huge volume attached to it. In my setup, I’ve chosen to run Prometheus on a node, by itself, with no other pods scheduled on it. I do this by setting up taints on a particular node and having Prometheus selectively schedule to that node and tolerate those taints. Normal pods without that toleration would then just refuse to schedule on it
(This is slightly different in the example app above)
# values.yaml
prometheus:
  prometheusSpec:

    # So that Prometheus can schedule onto the node with this taint
    # Other pods will not have this toleration and won't schedule on it
    tolerations:
    - key: "dedicated"
      operator: "Exists"
      effect: "NoSchedule"
    - key: "dedicated"
      operator: "Exists"
      effect: "NoExecute"

    # The Prometheus node
    nodeSelector:
      node: prometheus

    # This PV is named in my case, but you can also just do a dynamic claim template like here:
    # https://github.com/aranair/k8s-prometheus-operator-helm-example/blob/master/clustermon/values.yaml#L181-L189
    storageSpec:
      volumeClaimTemplate:
        spec:
          volumeName: prometheus-pv
          selector:
            matchLabels:
              app: prometheus-pv
          resources:
            requests:
              storage: 1500Gi
      selector: {}
If you take a look at the prometheus-operator’s default [values.yaml][helm-chart-values] file, you will find just about any configuration you can think of.
Monitoring Custom Services
The ServiceMonitor CRD from the prometheus-operators is used to describe the set of targets to be monitored by Prometheus; the
controller would automatically generate the Prometheus config needed.
For example, a ServiceMonitor for monitoring Traefik, our ingress controller would look something like this:
additionalServiceMonitors:
  - name: traefik-monitor
    namespace: monitoring
    selector:
      matchLabels:
        app: traefik   # this should be the selector for the Service
    namespaceSelector:
      matchNames:
      - kube-system    # Which namespace to look for the Service in
    endpoints:
    - basicAuth:       # Take creds from secret named traefik-monitor-metrics-auth
        password:
          name: traefik-monitor-metrics-auth
          key: password
        username:
          name: traefik-monitor-metrics-auth
          key: user
      port: metrics
      interval: 10s
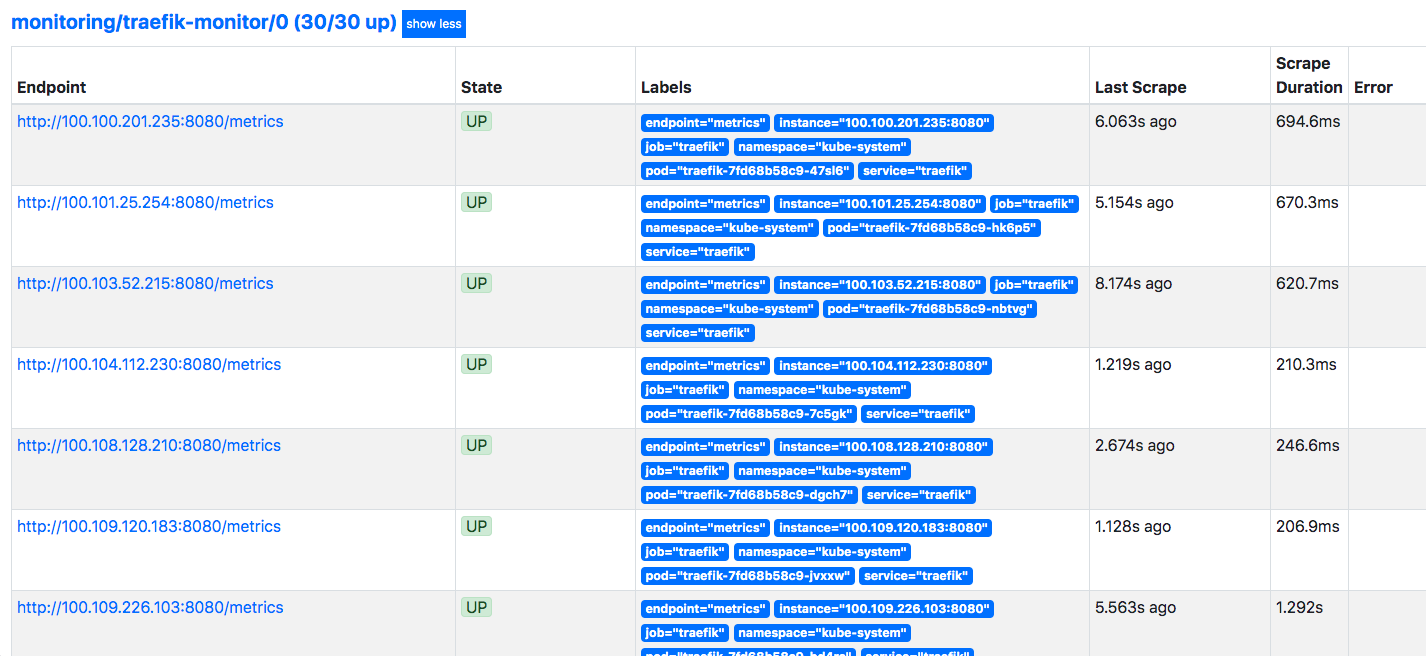
These would show up as targets in the prometheus deployment, e.g.
You can then use PromQL to query things.. like average number of open connections per second looking back at 5min windows, (then extrapolate to 5mins by multiplying by 300)
Charting isnt the best in Prometheus but to be fair, that’s not really the primary function of Prometheus. It can get you what you need eventually, but it just takes way more effort than it should.
Grafana
Grafana fills that gap; with this setup, a Grafana instance is automatically setup with Prometheus targeted as a data source. So generally what I’ll do is experiement in Prometheus with PromQL, then port over to a Grafana dashboard with proper variables and timeframes then export in json and check that in into our git repository. Overtime, we have developed quite a number of dashboards that monitor many of the services in our cluster (as well as many good default mixins provided out of the box).
One example is shown below, where it displays the total CPU/RAM usage; we can also click to drill down to each individual pod.
This next one is a dashboard that I built to monitor the health of Traefik, looking at the number of times its had to hot-reload configurations, and latencies and other useful metrics. We also track the Apdex for example for both entrypoints and backends.
Prometheus Rules
Prometheus rules can be defined in PromQL; these are primarily alerts that you might want the system to flag. There are many built-in rules that come along with the default installation.
Like when the kube api pods’ error rate is high:
alert: KubeAPIErrorsHigh
expr: sum(rate(apiserver_request_count{code=~"^(?:5..)$",job="apiserver"}[5m]))
  / sum(rate(apiserver_request_count{job="apiserver"}[5m])) * 100 > 3
for: 10m
labels:
  severity: critical
annotations:
  message: API server is returning errors for {{ $value }}% of requests.
  runbook_url: https://github.com/kubernetes-monitoring/kubernetes-mixin/tree/master/runbook.md#alert-name-kubeapierrorshigh
Or like when there are CLBO pods:
alert: KubePodCrashLooping
expr: rate(kube_pod_container_status_restarts_total{job="kube-state-metrics"}[15m])
  * 60 * 5 > 0
for: 1h
labels:
  severity: critical
annotations:
  message: Pod {{ $labels.namespace }}/{{ $labels.pod }} ({{ $labels.container }})
    is restarting {{ printf "%.2f" $value }} times / 5 minutes.
  runbook_url: https://github.com/kubernetes-monitoring/kubernetes-mixin/tree/master/runbook.md#alert-name-kubepodcrashlooping
But you can also define your own custom ones; we have quite a number of custom rules. As an example, there is an alert that will fire when there are > 10 etcd failed proposals in the past 10 mins, which might indicate some stability issues with the etcd cluster.
additionalPrometheusRules:
  - name: custom-alerts
    groups:
    - name: generic.rules
      rules:
      - alert: EtcdFailedProposals
        expr: increase(etcd_server_proposal_failed_total[10m]) > 10
        labels:
          severity: warning
          group: tulip
        annotations:
          summary: "etcd failed proposals"
          description: "{{ $labels.instance }} failed etcd proposals over the past 10 minutes has increased. May signal etcd cluster instability"
Or when a specific pod has restarted X number of times:
...
    - name: generic.rules
        - alert: TraefikPodCrashLooping
          expr: round(increase(kube_pod_container_status_restarts_total{pod=~"traefik-.*"}[5m])) > 5
          labels:
            severity: critical
            group: tulip
          annotations:
            summary: "Traefik pod is restarting frequently"
            description: "Traefik pod {{$labels.pod}} has restarted {{$value}} times in the last 5 mins"
When these alerts fire, you can see them in Prometheus directly; they are also sent off to the AlertManger if one is linked up with Prometheus.
AlertManager
AlertManager can be configured to send to Slack, VictorOps, PagerDuty, or various other sorts of alerting systems.
alertmanager:
  config:
    global:
      smtp_auth_username: ''
      smtp_auth_password: ''
      victorops_api_key: ''
      victorops_api_url: ''
In our setup, I configured it to post to Slack whenever there is a Warning level alert, and to VictorOps when there is a critical level alert.
route:
  group_by: ['job']
  group_wait: 30s
  group_interval: 5m
  repeat_interval: 12h
  receiver: 'null'

  # This can be used to route specific specific type of alerts to specific teams.
  routes:
  - match:
      alertname: DeadMansSwitch
    receiver: 'null'
  - match:
      alertname: TargetDown
    receiver: 'null'
  - match:
      severity: warning
      group: custom
    group_by: ['namespace']
    receiver: 'slack'
  - match:
      severity: critical
      group: custom
    group_by: ['namespace']
    receiver: 'victorops'

  receivers:
  - name: 'null'
  - name: 'sysadmins-email'
    email_configs:
      - to: 'sysadmin@example.com'

  - name: 'slack'
    slack_configs:
      - username: 'Prometheus'
        send_resolved: true
        api_url: ''
        title: '[{{ .Status | toUpper }}] Warning Alert'
        text: >-
          {{ template "slack.techops.text" . }}

  - name: 'victorops'
    victorops_configs:
      - routing_key: 'routing_key'
        message_type: '{{ .CommonLabels.severity }}'
        entity_display_name: '{{ .CommonAnnotations.summary }}'
        state_message: >-
          {{ template "slack.techops.text" . }}
        api_url: ''
        api_key: ''
Generally speaking, warning alerts could indicate some level of degraded service but might self-recover, such as when a node is down and pods auto-reschedule;
or they could also be non time-critical situations that does not need immediate intervention. And critical alerts are reserved for mission-critical services
or infrastructure, that can cause a bunch of issues if not recovered quickly. These would page someone and be resolved as quickly as we can.
Example of an alert that has gone off in AlertManager:
Slack Alert:
From here, you can have inhibitions that, when present, other alerts will not fire; or silences that would silence alerts based on their tags.
Wrap-up
Together, I think the 3 components form a rather well-rounded monitoring stack for k8s infrastructure and services’ metrics. I think, down the road, the next big extension would be to have it spin up federated clusters to monitor different AWS regions and/or clusters.
PS: Here’s the repo that has a simplified version of everything I’ve talked about above: k8s-prometheus-operator-helm-example. And feel free to let me know in the comments section below if you have any questions or run into any issues playing with that example.


