Lately, I had the chance to work on some data integration at Pocketmath where I wrote a bunch of Spark scripts in Scala to run some transformations on a data set of about 250GB that will run on a monthly basis. In this post, I talk about some of the problems I encountered, and some considerations while setting up the cluster and also how I improved the performance of the the Spark tasks.
Dataset Size
The size of the data set is only 250GB, which probably isn’t even close to the scale other data engineers handle, but is easily one of the bigger sets for me. Nonetheless, I do think the transformations are on the heavy side; it involves a chain of rather expensive operations.
Multiple Shuffle Operations
The sequence of execution is something like JOIN, JOIN, UNION, EXPLODE, SORT within partition,
then GROUP, COLLECT and finally another SORT eventually.
Each of these are pretty expensive shuffle operations. Not surprisingly, these operations posed some problems even at this moderate data size.

Another Difficulty
On top of that, I also had to split a file that looks like the examples below.
Essentially, I think of it as generating ranks or row numbers (of course, with a bunch of other data transformations)
From this format:
51abebcfab2ef2abeed2f 8,120,384,898
21abfbbeef5791adef3f2 1,9,1214,8827
...
Into these two files:
# 1,2 are like IDs
51abebcfab2ef2abeed2f 1
21abfbbeef5791adef3f2 2
...
1 8,120,384,898
2 1,9,1214,8827

...
It turns out that generating a consistent row number like this is a difficult operation for Spark to handle. Matter of fact, it is probably an expensive task for any distributed system to perform.
Dataframes are available in Spark 2.0 and I mainly use that data structure. The only way that I know of currently to
generate these row numbers with a Dataframe is to first convert into an RDD and do a zipWithIndex on it.
val segRdd = segmentIdGroups.rdd
val rows = segRdd.zipWithIndex.map { case (r: Row, id: Long) => Row.fromSeq((id+1) +: r.toSeq) }
Okay, there is actually another method that involves windows and partitions but unfortunately it basically moves all the data into one partition, which isn’t feasible for me.
Executer Cores and Memory Allocation
While starting the Spark task in Amazon EMR, I manually set the --executor-cores and --executor-memory
configurations. The calculation is somewhat non-intuitive at first because I have to manually take into account
the overheads of YARN, the application master/driver cores and memory usage et cetera.
As a guideline, YARN overheads take roughly 7% and allocating more from there is generally good practice. This
ensures enough is left for system processes and Hadoop e.g.
Using an instance of r3.8xlarge as an example:
# 122GB RAM, 16 cores

$CORES_PER_DRIVER=4
$MEMORY_PER_DRIVER=24G

$CORES_PER_EXECUTOR=4
$MEMORY_PER_EXECUTOR=24G
Each instance could potentially run 4 executors, with 4 cores per executor. Available memory for the HEAP is 122/4 = 30.5G.
To account for the overheads, I multiply the available memory by 0.93. This works out to be 28G. For my experiment, I used 24G just to account for the overheads but on hindsight, 26G should be enough too.
Recap:
total_memory_available / total_cores_available * (1 - 0.07)

// 122GB/16 * (1 - 0.07) = 28G
// Leave some leeway, to 24-26G
This directly affects how many executors that can be deployed per instance and also affects the memory available for each task, and consequently for each shuffle operation.
Task / Partition Size
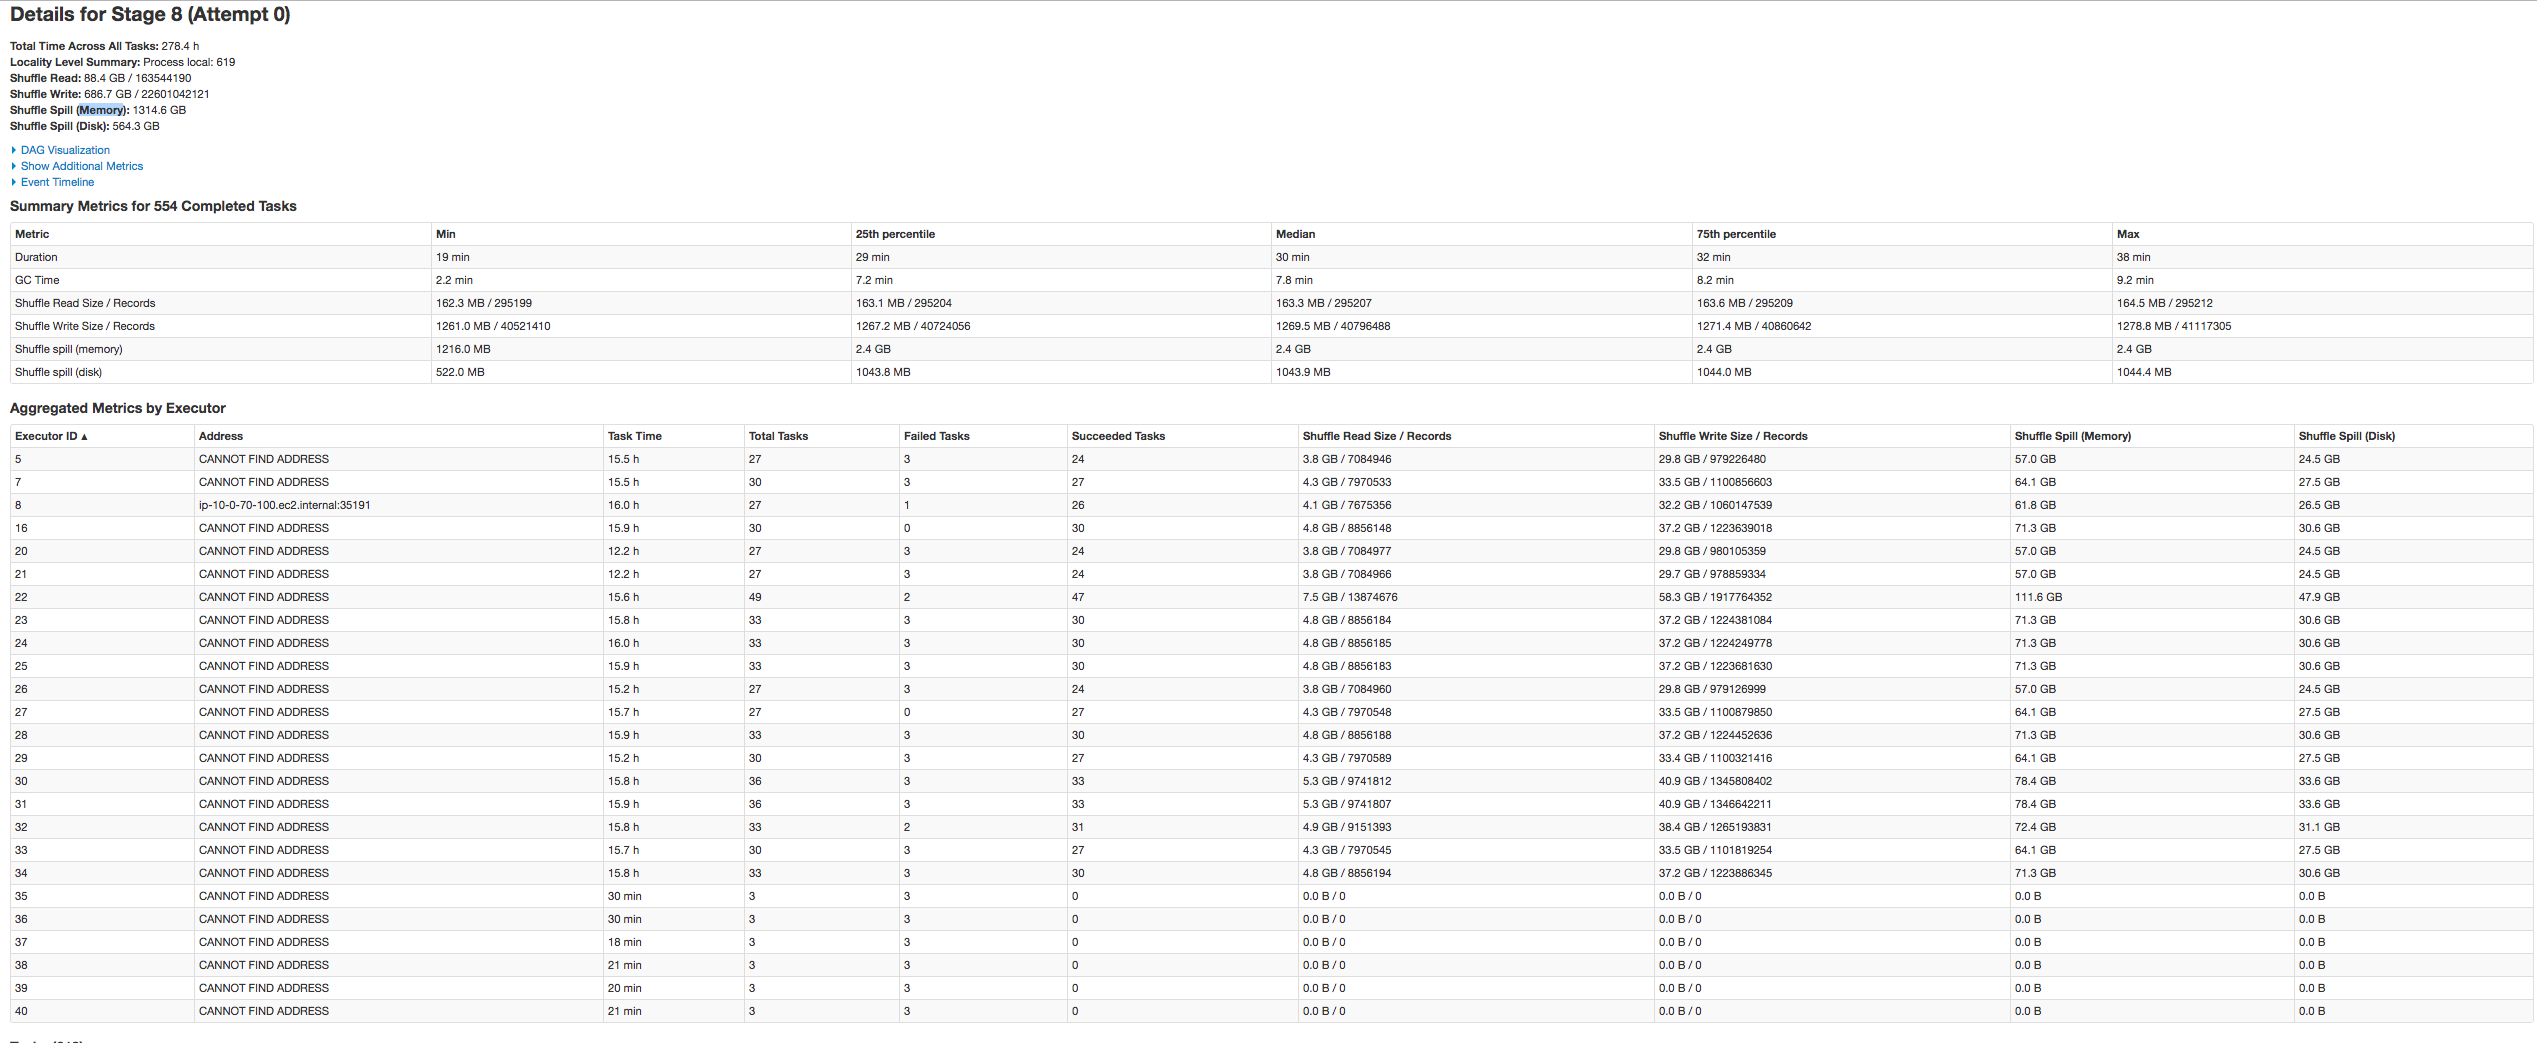
Another critical configuration is the task size; it is something that I think should be considered carefully because the task will slow down by quite a bit if it starts to spill to disk.
Initially, I just set the default_parallelism in Spark and expected the system to automatically
handle the rest, and was surprised to see some stages spilling to disk causing the cluster to slow down.
I later found out that default_parallelism is only used for certain operations and for the rest of the time,
Spark would infer the size by looking at the input from a previous stage, which happens to be the number of files
it reads: 300.
Each of these files are roughly 800-900MB. And having that few paritions is not ideal since each of these tasks / partitions will be too big to fit into memory.
Well alright, this actually depends on your executor setup too.
I had to force a repartition via df.repartition(2000) right after the reading of the files.
This would immediately add a shuffle step but performs better later on in other tasks in my opinion, YMMV though.
Shuffle Memory Usage, Executor Memory-to-CPU ratio
In general, I tried to optimize the system to avoid any form of spilling, both memory and disk. If the entire shuffle operation can fit into memory, there will be no spilling.
Each core in an executor runs a single task at any one time. Hence, with 26GB per executor and 4 cores each executor, the HEAP_SIZE allocated for each task is 26G/4 or 4G.
However, not all the memory allocated to the executor is used for shuffle operations.
The memory available for shuffle can be calculated as such:
// Per task
24/4 * 0.2 * 0.8 = 0.96GB

// 0.2 -> spark.shuffle.memoryFraction
// 0.8 -> spark.shuffle.safetyFraction
If your task is already spilling to disk, try using this formula to find out how much space it actually needs. This might help you to better fine tune the RAM-to-CPU ratio for ur executor tasks.
shuffle_write * shuffle_spill_mem * (4)executor_cores
—————————————————————————————————————————————————————————————————————
shuffle_spill_disk * (24)executor_mem * (0.2)shuffle_mem_fraction * (0.8)shuffle_safety_fraction
Splitting the task size properly is probably one of the bigger improvements while tuning my cluster. Key takeaway: It is definitely better to err on a higher number of partitions, which results in a smaller task bite size.
Counter Example
To quickly illustrate how things can go wrong in a problematic configuration, I’ll use one of my iterations as an example.
I first used c3 & m3 instances and only allocated 10G per 3 cores. This works out
to be about 500MB for shuffling each task. I had only 300 partitions and my task sizes were well beyond 850MB.
It resulted in a ton more needless computations:
Getting the Right Partition Size and Instance Type
It is crucial to get the partition size right for it to run smoothly, but getting the right instance type makes it much more efficient.
Back to my setup, with about 2000 paritions and 250GB data, each partition or task works out to be only about 125MB, which is close to the 128MB that is recommended in the official docs.
At that partition size, it is more efficient to run c3.8xlarge instances with
a lower memory to core ratio. I did choose to use i2.2xlarge memory instances to
eliminate any possibility of a memory constraint issue but the c3.8xlarge would’ve been much faster.
# c3.8xlarge: 32 VCPUS, 60GB Memory
$CORES_PER_EXECUTOR=4
$MEMORY_PER_EXECUTOR=6.5G

# Available memory for shuffle, more than enough for 125mb
6.5 / 4 * 0.2 * 0.8 = 0.26G
Spot Instances and HDFS
Amazon EMR allows you to bid for spot instances at a fraction of the cost of the original instance price. I use them frequently and have found them to be massively discounted during some hours.
I had HDFS running for the cluster and the results of each result stage are stored into the HDFS for future use.
At first, I ran a test using spot instances completely, even for the CORE instance group, which turned out to be
a big mistake.
When I lose the instances, inevitably, from getting outbidded during peak hours, the cluster loses data. In my experience, Spark is unable to fully recover from the lost data, even after taking extra time for stage-retries.
With everything taken into consideration, I found it easier to just use on-demand instances for the CORE instance group entirely.
Instance Setup
I recommend using non-spot, disk-optimized instances for the CORE instance group. For example, I got two 800GB SSDs
with an i2.2xlarge which costs only ~$1.70 per hour. In comparison, c3 or r3 instances
give you way lesser disk space.
For the actual computation in the task instance group, I would switch to using only spot instances
(r3.8xlarge or c3.8xlarge). I’ve found that this was the most cost-efficient to run my task.
To bring it all together, I used 20 spot instances of r3.8xlarge. Mentioned this above, but I’ll say it again.
Memory instances were used just to eliminate any potential issue of shuffle spills but c3.8xlarge would’ve been more efficient
definitely as I’ve showned above. For the core group, there were 3 i2.2xlarge on-demand instances for the HDFS.
To Persist or Not?
In some of the heavy shuffles, I found that it was faster to persist them on disk to prevent re-calculations. This is especially true if you’re re-using scala variables further down the chain. Obviously, you’ll need to look into the total calculation time and compare it with the network read bytes (divided by an average network throughput) to see if it is worth while to persist.
One good thing is that the Amazon EMR handles the HDFS integrations seamlessly which makes
it effortless to do a DISK_ONLY persistance. One thing to note is that since I was doing some disk persistance,
I do end up using more disk space than the total data size. This is also why I chose to use the i2 instances
for HDFS.
Recalculations vs Persistence
Recalculations will yield different sequences every time.
In my case, having to generate a key for each row was the one requirement I couldn’t remove.
Without persisting it to disk first, using the variable again would cause a re-calculation
through the stages and zipWithIndex could potentially produce results which are
different each time and be rendered absolutely useless.
I was forced to persist them to disk but either way, since they were heavy operations, persisting them to disk made sense too.
Resources
All of the information has been sourced from multiple sources including, but not limited to: